Miami · Value-add multifamily
Seagrape Gardens Apartments
A 1974 garden-style community of 124 units in Kendall, bought at $24,600,000 ($198k a unit, a 5.35% cap on normalized T-12 NOI), with 96 interiors renovated over 20 months, new roofs and impact windows, a bridge loan with future funding, a fixed-rate refinance in month 36 and a sale at the end of year 5.
Tab explorer
Inside the workbook
Click a tab name. Previews are rendered from the recalculated file.
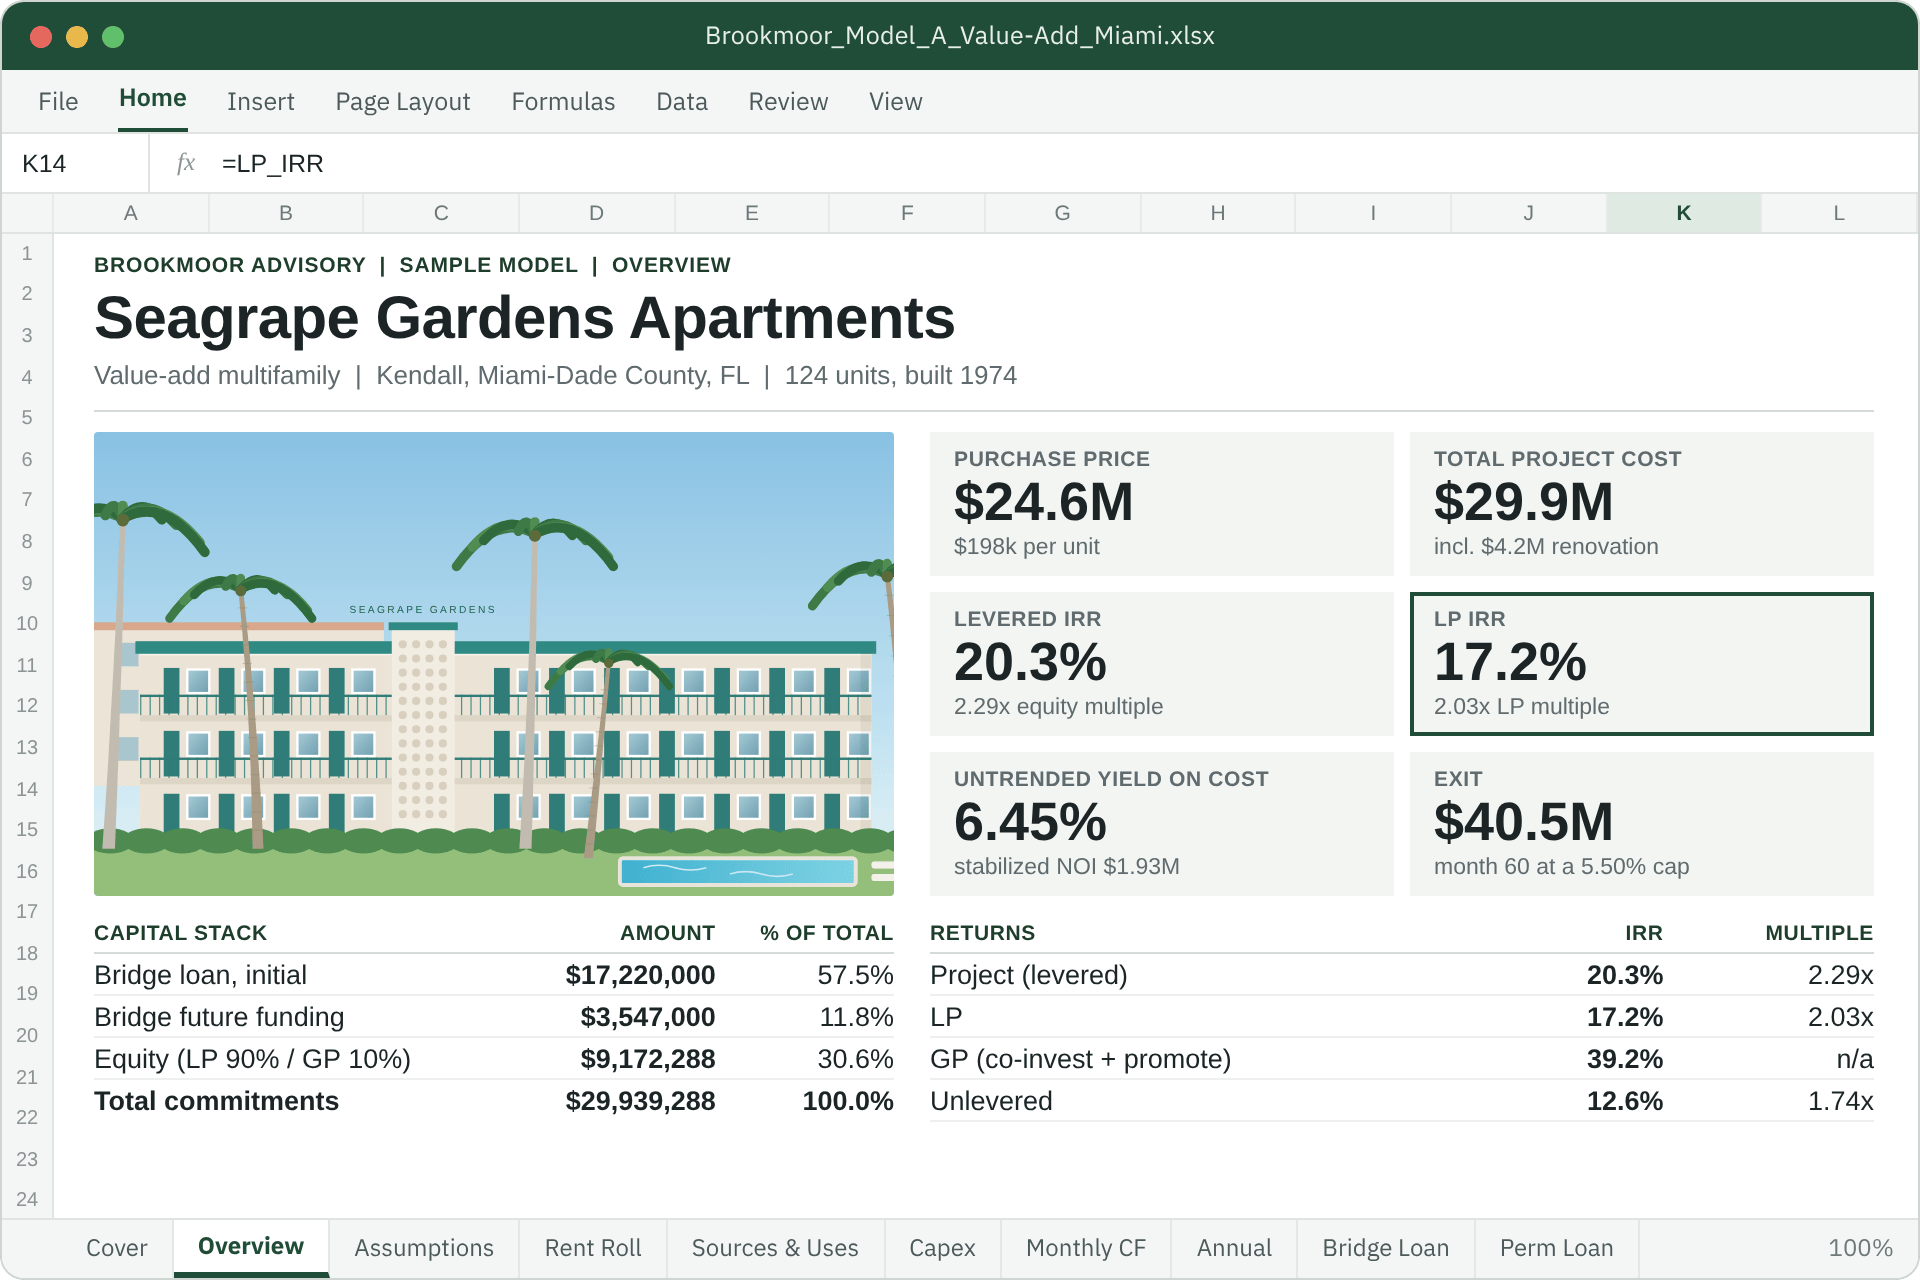
A one-page summary at the front of the workbook: the property, six headline numbers, the capital stack and returns by party. Every figure is a live formula on the model’s named cells.
Deal summary
| Item | Value |
|---|---|
| Units / rentable SF | 124 / 106,880 |
| In-place rent (avg) | $1,946 per month |
| Classic market rent (avg) | $2,154 per month |
| Renovation premium | $300 per unit per month |
| Units renovated | 96 of 124, 5 a month from month 3 |
| Renovation budget | $4,173,400 incl. 10% contingency |
| Insurance | $3,400 per unit (wind, flood, liability) |
| Normalized T-12 NOI | $1,316,578 |
| Adjusted NOI (taxes reassessed) | $1,303,378 |
| Stabilized NOI, untrended | $1,932,418 |
| Rent lift, in-place to stabilized | 22.6% |
Key returns
| Measure | Value |
|---|---|
| Levered IRR / multiple | 20.3% / 2.29x |
| LP IRR / multiple | 17.2% / 2.03x |
| GP IRR (co-invest + promote) | 39.2% |
| Unlevered IRR / multiple | 12.6% / 1.74x |
| Profit (total / LP) | $11,863,253 / $8,462,234 |
| Peak equity | $9,172,288 |
| Sale price (month 60) | $40,452,808 at 5.50% |
| Year-1 / year-5 DSCR | 1.06x / 1.32x |
| Debt yield at refinance | 8.75% |
| Checks | 28 of 28 TRUE |
Capital stack
| Source | Amount | Share |
|---|---|---|
| Bridge loan, initial advance | $17,220,000 | 57.5% |
| Bridge future funding | $3,547,000 | 11.8% |
| Equity (LP 90% / GP 10%) | $9,172,288 | 30.6% |
| Total uses | $29,939,288 | 100.0% |
| Perm loan at month 36 | $22,990,000 | DSCR binds |
| Net refinance proceeds | $2,062,225 | 22% of equity |
Charts
What the monthly model does
Data table
| Month | Renovated units | Monthly NOI |
|---|---|---|
| M1 | 0 | $109,715 |
| M6 | 15 | $115,865 |
| M12 | 45 | $135,706 |
| M18 | 75 | $149,850 |
| M22 | 95 | $164,147 |
| M24 | 96 | $166,480 |
| M36 | 96 | $171,028 |
| M48 | 96 | $175,697 |
| M60 | 96 | $180,489 |
Data table
| Year | NOI | NCF after reserves | Debt service | DSCR |
|---|---|---|---|---|
| Year 1 | $1,428,459 | $1,391,259 | $1,313,028 | 1.06x |
| Year 2 | $1,831,801 | $1,793,299 | $1,431,501 | 1.25x |
| Year 3 | $2,052,334 | $2,012,484 | $1,443,306 | 1.39x |
| Year 4 | $2,108,358 | $2,067,114 | $1,609,961 | 1.28x |
| Year 5 | $2,165,869 | $2,123,181 | $1,609,961 | 1.32x |
Sensitivities
Formula-driven grids
Each cell is a full recomputation of the monthly model. The shaded cell is the base case and ties to the Returns tab.
Levered IRR: exit cap rate by renovation premium
| Exit cap \ Premium | $200 | $250 | $300 | $350 | $400 |
|---|---|---|---|---|---|
| 5.00% | 20.9% | 22.8% | 24.6% | 26.5% | 28.2% |
| 5.25% | 18.7% | 20.6% | 22.4% | 24.3% | 26.1% |
| 5.50% | 16.4% | 18.4% | 20.3% | 22.1% | 24.0% |
| 5.75% | 14.2% | 16.2% | 18.1% | 20.0% | 21.9% |
| 6.00% | 12.0% | 14.0% | 16.0% | 18.0% | 19.9% |
Red: below a 15% levered IRR. Premium in $ per unit per month over classic market rent.
Levered IRR: purchase price by exit cap rate
| Price \ Exit cap | 5.00% | 5.25% | 5.50% | 5.75% | 6.00% |
|---|---|---|---|---|---|
| $23.4M | 28.4% | 26.2% | 24.1% | 22.0% | 20.0% |
| $24.0M | 26.5% | 24.3% | 22.2% | 20.1% | 18.0% |
| $24.6M | 24.6% | 22.4% | 20.3% | 18.1% | 16.0% |
| $25.2M | 22.9% | 20.6% | 18.4% | 16.3% | 14.1% |
| $25.8M | 21.1% | 18.9% | 16.6% | 14.4% | 12.3% |
Guidance was $26.25M. At $25.8M and a 5.50% exit the levered IRR is 16.6%.
Equity multiple: exit cap rate by renovation premium
| Exit cap \ Premium | $200 | $250 | $300 | $350 | $400 |
|---|---|---|---|---|---|
| 5.00% | 2.44x | 2.58x | 2.73x | 2.87x | 3.02x |
| 5.25% | 2.22x | 2.36x | 2.50x | 2.64x | 2.78x |
| 5.50% | 2.03x | 2.16x | 2.29x | 2.43x | 2.56x |
| 5.75% | 1.85x | 1.98x | 2.10x | 2.23x | 2.36x |
| 6.00% | 1.69x | 1.81x | 1.93x | 2.06x | 2.18x |
Levered profit: purchase price by exit cap rate
| Price \ Exit cap | 5.00% | 5.25% | 5.50% | 5.75% | 6.00% |
|---|---|---|---|---|---|
| $23.4M | $17.75M | $15.65M | $13.73M | $11.99M | $10.39M |
| $24.0M | $16.79M | $14.70M | $12.80M | $11.06M | $9.47M |
| $24.6M | $15.84M | $13.76M | $11.86M | $10.14M | $8.55M |
| $25.2M | $14.88M | $12.81M | $10.93M | $9.21M | $7.63M |
| $25.8M | $13.93M | $11.87M | $9.99M | $8.28M | $6.72M |
Notes on method
- Revenue build. Gross potential rent at classic market rent, plus the premium on renovated units, less loss-to-lease that closes over 12 months, less one month of downtime per renovated unit, less 5.0% vacancy and 1.0% credit loss. In-place rents average $1,946; classic market $2,154; the premium is $300.
- Florida lines. Taxes at the seller's assessment ($405,000) through month 12, then 85% of the purchase price at 20.0 mills (illustrative), growing 3% a year. Documentary stamp tax (0.35%) and intangible tax (0.20%) on the bridge note at close and on the perm note at refinance. Insurance at $3,400 per unit for wind, flood and liability; expenses trend at 3.5% against 3.0% rents.
- Capex. 96 interiors at $16,500, roofs on all nine buildings, impact windows and doors, a recertification and building-safety repair line (Miami-Dade 40/50-year cycle, illustrative scope), site, amenities and plumbing. $4,173,400 with 10% contingency.
- Bridge loan. 70% of price at closing plus future funding of 85% of the renovation budget, SOFR plus 350 bps, interest-only, 1.0% origination, 0.25% exit fee, a rate cap and a $250,000 interest and operating reserve drawn only if NCF falls below interest. Interest accrues on the prior month-end balance, so there is no circular reference.
- Refinance and sale. Month 36, fixed rate at 5.75% with 30-year amortization, sized at the lesser of 65% LTV (at a 5.50% cap), 1.25x DSCR and 8.0% debt yield on trailing-12 figures. Sale at month 60 on forward 12-month NOI at a 5.50% cap, 20 bps above the adjusted going-in cap. No cap-rate compression is assumed.
- Waterfall. LP 90% / GP 10%, 8% compounding preferred return, then promotes of 20% to a 12% IRR, 30% to 15% and 40% above, computed monthly. The GP's promote totals $2,460,771 of $11,863,253 of profit.
- What a reviewer should push on. Year-one DSCR on the bridge is 1.06x: the reserve covers it, but it is the risk. The rent lift from in-place to stabilized is 22.6%; the premium needs comps. The refinance returns 22% of equity at month 36, which flatters the IRR relative to the multiple.
Want to walk through the full workbook?
I am happy to share the model on a call and talk through the assumptions.