New York · Office-to-residential conversion
Carver Exchange Building
A 1962 Class B office building in the Financial District bought at $169 per RSF and converted to 162 apartments over 20 months, financed with a senior construction loan, C-PACE, preferred equity and common equity, with the city's conversion incentive and its affordable set-aside modeled as one toggle.
Tab explorer
Inside the workbook
Click a tab name. Previews are rendered from the recalculated file.
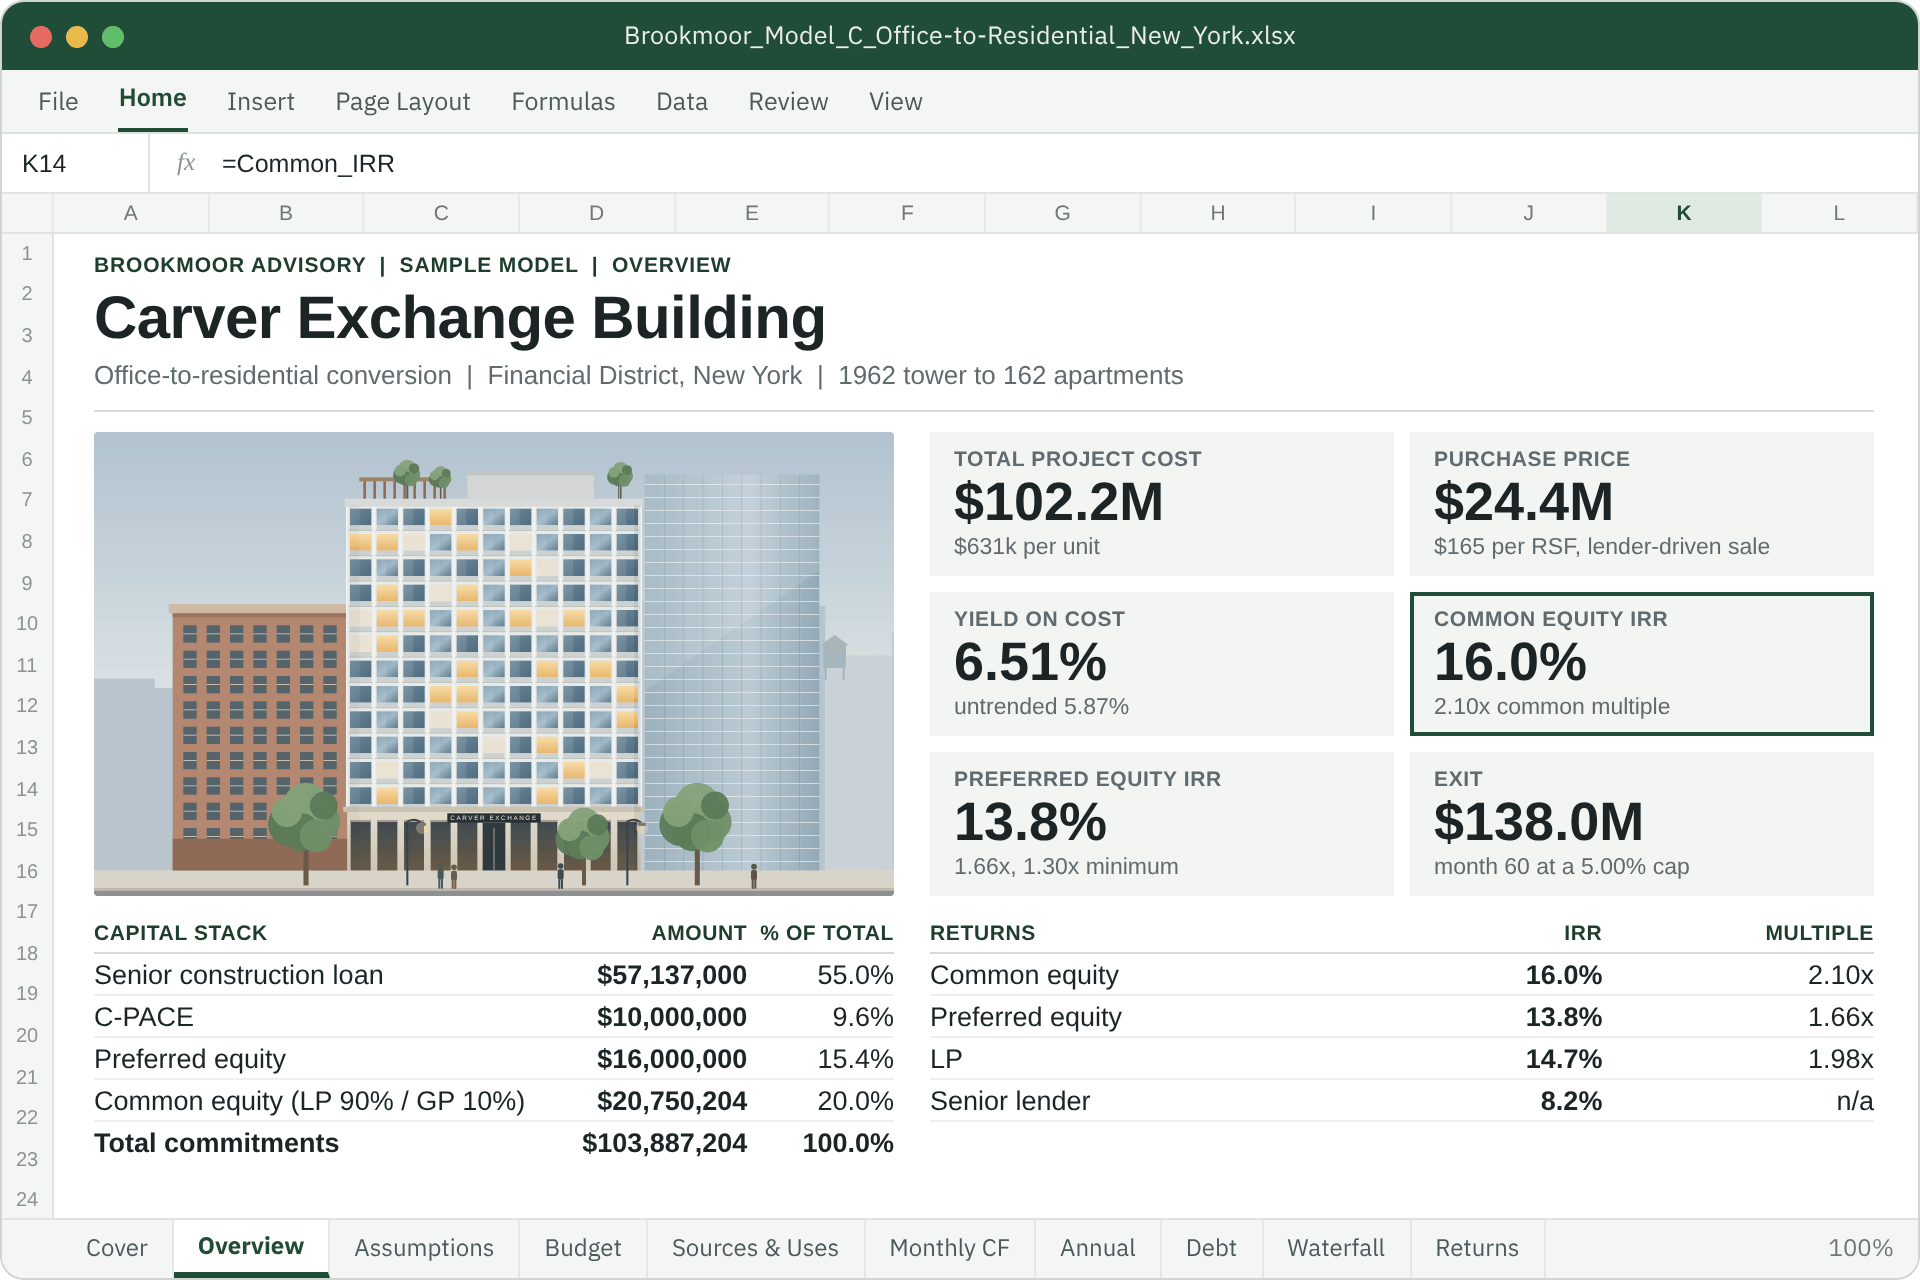
A one-page summary at the front of the workbook: the property, six headline numbers, the capital stack and returns by party. Every figure is a live formula on the model’s named cells.
Deal summary
| Item | Value |
|---|---|
| Office RSF / GSF | 148,000 / 155,000 |
| Apartments / NSF | 162 / 101,700 |
| Income-restricted units (incentive on) | 41 (25%) at $2,300 blended |
| Purchase price | $24,420,000 ($169 per RSF all-in) |
| Conversion hard cost | $320 per GSF plus facade |
| Hard costs incl. 10% contingency | $57,310,000 |
| Soft costs incl. 7.5% contingency | $9,272,950 |
| Market rent (avg, 2027 $) | $5,159 per month |
| Construction / stabilization | months 10 to 29 / month 39 |
| Stabilized NOI, trended | $6,647,221 |
| Taxes, full / with incentive | $2,500,000 / $250,000 |
Key returns
| Measure | Value |
|---|---|
| Common equity IRR / multiple | 16.0% / 2.10x |
| LP IRR / multiple | 14.7% / 1.98x |
| GP IRR (co-invest + promote) | 26.1% |
| Preferred equity IRR / multiple | 13.8% / 1.66x |
| Senior lender / C-PACE IRR | 8.2% / 8.3% |
| Unlevered IRR | 12.3% |
| Common profit | $22,867,016 |
| Sale price (month 60) | $137,977,984 at 5.00% |
| Perm DSCR / combined LTV | 1.25x / 56.6% |
| Checks | 31 of 31 TRUE |
Capital stack
| Source | Amount | Share |
|---|---|---|
| Senior construction loan | $57,137,000 | 55.0% |
| C-PACE | $10,000,000 | 9.6% |
| Preferred equity | $16,000,000 | 15.4% |
| Common equity (LP 90% / GP 10%) | $20,750,204 | 20.0% |
| Total budget | $103,887,204 | 100.0% |
| Perm loan at month 44 | $64,644,000 | DSCR binds |
Charts
What the monthly model does
Data table
| Year | Common | Pref | C-PACE | Senior |
|---|---|---|---|---|
| Year 0 | $20.75M | $6.97M | $0.00M | $0.00M |
| Year 1 | $0.00M | $5.41M | $0.00M | $0.00M |
| Year 2 | $0.00M | $3.62M | $8.44M | $41.27M |
| Year 3 | $0.00M | $0.00M | $1.56M | $14.11M |
| Year 4 | $0.00M | $0.00M | $0.00M | $0.03M |
Sensitivities
Formula-driven grids
Each cell is a full recomputation of the monthly model. The shaded cell is the base case and ties to the Returns tab.
Common equity IRR: conversion hard cost by exit cap rate
| Hard cost \ Exit cap | 4.50% | 4.75% | 5.00% | 5.25% | 5.50% |
|---|---|---|---|---|---|
| $280/GSF | 29.5% | 26.1% | 22.7% | 19.3% | 15.7% |
| $300/GSF | 26.2% | 22.7% | 19.3% | 15.7% | 12.1% |
| $320/GSF | 23.1% | 19.6% | 16.0% | 12.4% | 8.6% |
| $340/GSF | 20.2% | 16.6% | 13.0% | 9.2% | 5.3% |
| $360/GSF | 17.4% | 13.8% | 10.1% | 6.2% | 2.1% |
Red: below a 12% common IRR. $20 per GSF moves the common IRR about 3.1 points.
Preferred equity IRR: conversion hard cost by exit cap rate
| Hard cost \ Exit cap | 4.50% | 4.75% | 5.00% | 5.25% | 5.50% |
|---|---|---|---|---|---|
| $280/GSF | 13.8% | 13.8% | 13.8% | 13.8% | 13.8% |
| $300/GSF | 13.8% | 13.8% | 13.8% | 13.8% | 13.8% |
| $320/GSF | 13.8% | 13.8% | 13.8% | 13.8% | 13.8% |
| $340/GSF | 13.8% | 13.8% | 13.8% | 13.8% | 13.8% |
| $360/GSF | 13.8% | 13.8% | 13.8% | 13.8% | 13.8% |
The pref earns its accrual in every cell shown; the 1.30x minimum binds at the refinance redemption.
Common equity IRR: conversion incentive by market rent
| Incentive \ Rent | 0.90x | 0.95x | 1.00x | 1.05x | 1.10x |
|---|---|---|---|---|---|
| On | 4.4% | 10.8% | 16.0% | 20.5% | 24.4% |
| Off | -29.6% | -13.5% | -1.6% | 7.8% | 15.3% |
Off means full taxes and all units at market rent. Without the incentive the deal does not work at any rent in the range.
Perm loan at refinance: conversion incentive by market rent
| Incentive \ Rent | 0.90x | 0.95x | 1.00x | 1.05x | 1.10x |
|---|---|---|---|---|---|
| On | $55.9M | $60.3M | $64.6M | $69.0M | $73.3M |
| Off | $41.1M | $47.0M | $52.8M | $58.6M | $64.4M |
The incentive is worth about $11.8M of refinance proceeds at base rents, after giving up the set-aside rent.
Notes on method
- Acquisition and pre-development. A 1962 fourteen-story Class B office of 148,000 RSF in the Financial District bought at $24,420,000 ($169 per RSF all-in). Three residual tenants pay rent against carrying costs in months 1 to 9 while filings and design run; one is bought out for $260,000. Conversion to 162 apartments on 101,700 NSF, a 66% efficiency that reflects the deep floor plate.
- Incentive toggle (illustrative, not tax advice). Modeled loosely on the city's commercial-conversion program: with the toggle on, 90% of residential taxes are abated and 25% of units (41) are income-restricted at a blended $2,300 a month. Tax saving $2,250,000 a year against $1,336,418 of rent given up: a net $913,582. Off means full taxes and every unit at market.
- Capital stack. Senior construction loan $57,137,000 (55% of budget, SOFR plus 375 bps), C-PACE $10,000,000 at 7.25% fixed over 25 years paid like a tax, preferred equity $16,000,000 at a 13% compounding accrual with 8% current pay after stabilization and a 1.30x minimum multiple, and common equity of $20,750,204. Funding order: common, pref, then C-PACE and senior.
- Refinance and sale. Month 44, 5.75% fixed, sized at the lesser of 65% combined LTV less the C-PACE balance, 1.25x DSCR on NCF after the assessment, and 8.0% debt yield. DSCR binds at $64,644,000. Proceeds redeem the pref before the common sees a dollar. Sale at month 60 at 5.00% on forward NOI with 2.5% of costs (an allowance for transfer taxes), the C-PACE repaid at closing.
- Returns by tranche. Senior 8.2%, C-PACE 8.3%, preferred 13.8% and 1.66x, common 16.0% and 2.10x, LP 14.7%, GP 26.1%. Unlevered 12.3%.
- What a reviewer should push on. Pref at 13% against an unlevered return of 12.3% is expensive money; it earns its place by replacing common equity at the bottom of the stack. The hard-cost grid is steep. And everything depends on the incentive surviving its term, which is a legal question, not a modeling one.
Want to walk through the full workbook?
I am happy to share the model on a call and talk through the assumptions.