Boston · Ground-up development
Fenwick Yard Apartments
A 152-unit, 5-over-1 mid-rise in Allston: 10 months of Article 80-style pre-development, 22 months of construction on a hard-cost S-curve, 26 income-restricted units, equity-first funding, a construction loan at 62.5% of cost with capitalized interest, a 16-unit-a-month lease-up, a refinance after stabilization and a sale six years from land closing.
Tab explorer
Inside the workbook
Click a tab name. Previews are rendered from the recalculated file.
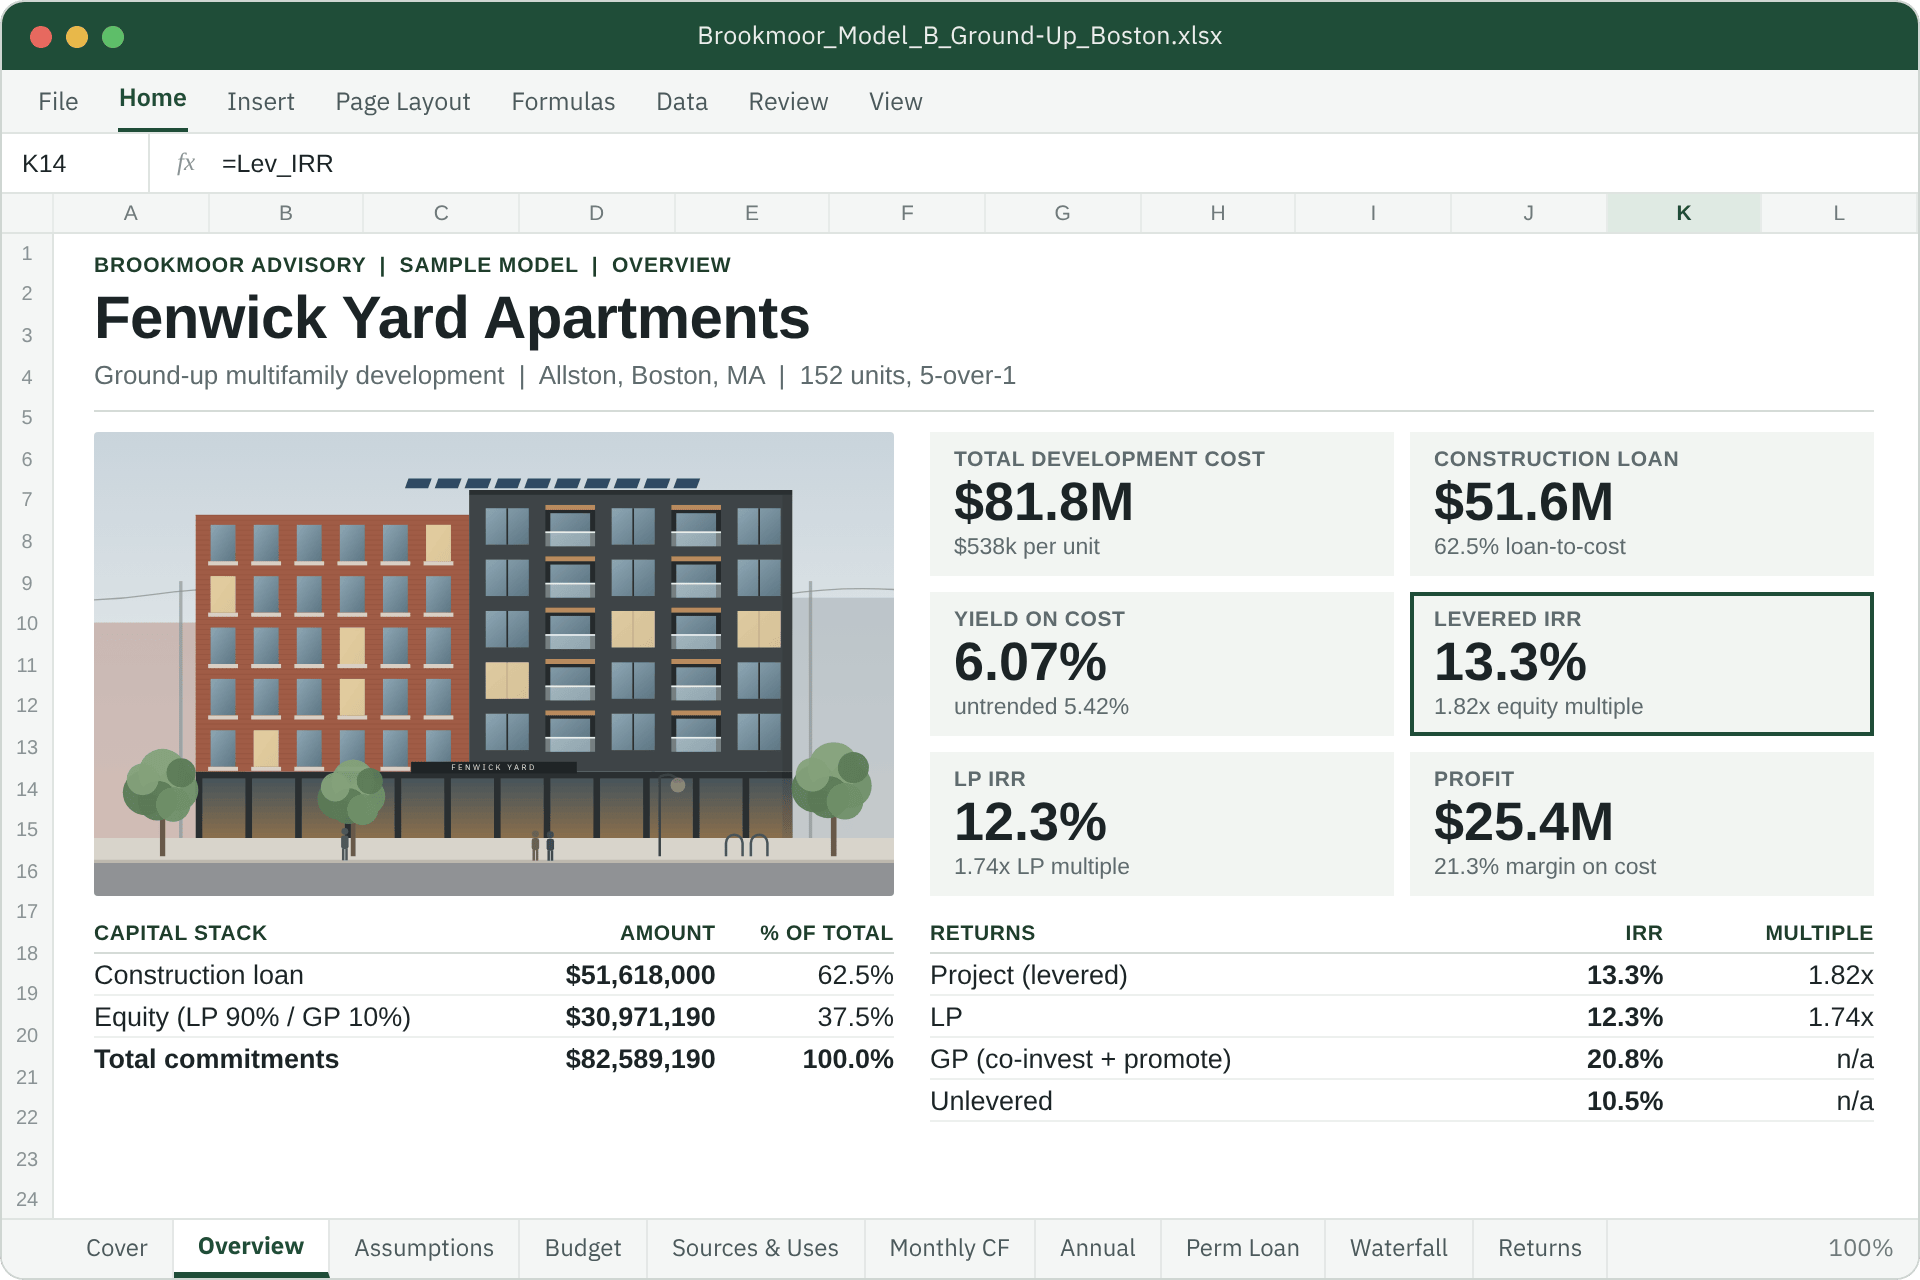
A one-page summary at the front of the workbook: the property, six headline numbers, the capital stack and returns by party. Every figure is a live formula on the model’s named cells.
Deal summary
| Item | Value |
|---|---|
| Units / GSF / NSF | 152 / 138,000 / 118,700 |
| Income-restricted units | 26 (17%) at $1,900 blended |
| Land | $6,840,000 ($45k per unit) |
| Building hard cost | $360 per GSF |
| Hard costs incl. contingency | $56,994,000 |
| Soft costs incl. pre-development and linkage | $10,288,530 |
| Developer fee | $2,597,880 |
| Market rent (avg, 2027 $) | $4,300 per month |
| Pre-development / construction / stabilization | 10 months / 22 months / month 42 |
| Stabilized NOI, trended | $4,963,813 |
| Margin on cost | 21.3% |
Key returns
| Measure | Value |
|---|---|
| Levered IRR / multiple | 13.3% / 1.82x |
| LP IRR / multiple | 12.3% / 1.74x |
| GP IRR (co-invest + promote) | 20.8% |
| Unlevered IRR / multiple | 10.5% / 1.53x |
| Profit (total / LP) | $25,414,025 / $20,736,055 |
| Untrended / trended yield on cost | 5.42% / 6.07% |
| Development spread | 107 bps |
| Sale price (month 72) | $105,819,573 at 5.00% |
| Perm DSCR / debt yield | 1.25x / 8.61% |
| Checks | 31 of 31 TRUE |
Capital stack
| Source | Amount | Share |
|---|---|---|
| Construction loan | $51,618,000 | 62.5% |
| Equity (LP 90% / GP 10%) | $30,971,190 | 37.5% |
| Total budget | $82,589,190 | 100.0% |
| Actual cost (reserves partly unused) | $81,812,826 | |
| Perm loan at month 46 | $57,149,000 | DSCR binds |
| Net refinance proceeds | $5,735,874 | 19% of equity |
Charts
What the monthly model does
Data table
| Month | Hard costs | Total need | Equity | Loan |
|---|---|---|---|---|
| M0 | $0 | $6,942,600 | $6,942,600 | $0 |
| M5 | $0 | $194,116 | $194,116 | $0 |
| M10 | $0 | $3,011,542 | $3,011,542 | $0 |
| M11 | $342,563 | $521,304 | $521,304 | $0 |
| M14 | $2,076,791 | $2,403,547 | $2,403,547 | $0 |
| M17 | $3,232,943 | $3,658,375 | $3,658,375 | $0 |
| M18 | $3,489,866 | $3,937,226 | $3,421,150 | $516,075 |
| M20 | $3,811,019 | $4,312,031 | $0 | $4,312,031 |
| M23 | $3,811,019 | $4,385,994 | $0 | $4,385,994 |
| M26 | $3,232,943 | $3,828,981 | $0 | $3,828,981 |
| M29 | $2,076,791 | $2,632,409 | $0 | $2,632,409 |
| M32 | $342,563 | $907,286 | $0 | $907,286 |
| M36 | $0 | $378,935 | $0 | $378,935 |
Sensitivities
Formula-driven grids
Each cell is a full recomputation of the monthly model. The shaded cell is the base case and ties to the Returns tab.
Levered IRR: building hard cost by exit cap rate
| Hard cost \ Exit cap | 4.50% | 4.75% | 5.00% | 5.25% | 5.50% |
|---|---|---|---|---|---|
| $320/GSF | 21.7% | 19.6% | 17.5% | 15.5% | 13.6% |
| $340/GSF | 19.6% | 17.5% | 15.4% | 13.4% | 11.3% |
| $360/GSF | 17.6% | 15.4% | 13.3% | 11.2% | 9.2% |
| $380/GSF | 15.7% | 13.5% | 11.3% | 9.2% | 7.1% |
| $400/GSF | 13.9% | 11.6% | 9.4% | 7.2% | 5.1% |
Red: below a 12% levered IRR. Every $20 per GSF of hard cost moves the IRR about 2.0 points.
Trended yield on cost: hard cost by exit cap rate
| Hard cost \ Exit cap | 4.50% | 4.75% | 5.00% | 5.25% | 5.50% |
|---|---|---|---|---|---|
| $320/GSF | 6.60% | 6.60% | 6.60% | 6.60% | 6.60% |
| $340/GSF | 6.32% | 6.32% | 6.32% | 6.32% | 6.32% |
| $360/GSF | 6.07% | 6.07% | 6.07% | 6.07% | 6.07% |
| $380/GSF | 5.83% | 5.83% | 5.83% | 5.83% | 5.83% |
| $400/GSF | 5.61% | 5.61% | 5.61% | 5.61% | 5.61% |
Yield on cost does not depend on the exit cap; the spread to it does.
Levered IRR: absorption pace by market rent
| Pace \ Rent | 0.90x rent | 0.95x rent | 1.00x rent | 1.05x rent | 1.10x rent |
|---|---|---|---|---|---|
| 10 units/mo | 5.0% | 8.8% | 12.4% | 15.8% | 19.1% |
| 13 units/mo | 5.5% | 9.3% | 13.0% | 16.4% | 19.7% |
| 16 units/mo | 5.8% | 9.7% | 13.3% | 16.8% | 20.0% |
| 19 units/mo | 6.1% | 9.9% | 13.6% | 17.0% | 20.3% |
| 22 units/mo | 6.2% | 10.1% | 13.7% | 17.2% | 20.5% |
Market rent is the variable that matters; the income-restricted rents are fixed by the program.
Construction delay (one-dimensional)
| Delay | Levered IRR | Multiple | Profit | Cap. interest |
|---|---|---|---|---|
| 0 mo | 13.3% | 1.82x | $25.4M | $3.87M |
| 2 mo | 12.9% | 1.79x | $24.6M | $4.09M |
| 4 mo | 12.6% | 1.77x | $23.9M | $4.32M |
| 6 mo | 12.3% | 1.75x | $23.2M | $4.54M |
| 9 mo | 11.8% | 1.70x | $22.1M | $4.87M |
The refinance shifts with the delay; the sale date is fixed. Carry, interest and the lost months of NOI are all in the result.
Notes on method
- Timeline. Land closes at month 0 with Article 80 Large Project Review filed. Months 1 to 10 are pre-development (design development, review, community process, permit), funded by equity, with land carry of $18,000 a month. The construction loan closes at the permit; construction runs 22 months to TCO in month 32; refinance at month 46; sale at month 72.
- Boston lines (illustrative). 17% of units (26) are income-restricted at a blended $1,900 a month, growing 2% a year, against a market average of $4,300; blended rent $3,889. A $400,000 allowance for linkage-type and community-benefit payments is paid at the permit. Neither is legal advice: the programs set the share, the income levels and the applicability.
- Budget. Land $6.8M, building hard cost $360 per GSF on 138,000 GSF plus site work and tuck-under parking, 5% hard and soft contingencies, A&E at 4.5% of hard, pre-development soft costs of $1,600,000, a 3.5% developer fee, and construction-period carry of $58,000 a month that grows with any delay. Total development cost $81,812,826, $538k a unit.
- Funding. Construction loan at 62.5% of the total budget, SOFR plus 325 bps, interest-only, with the commitment solved so the origination fee is both a use and part of the base. Equity funds every dollar until its requirement of $30,971,190 is met; the loan funds the rest, including capitalized interest of $3,873,636 against reserve lines of $4,650,000.
- Refinance and sale. Month 46, 5.60% fixed, 30-year amortization, sized on forward 12-month NOI at the lesser of 65% LTV at a 5.00% cap, 1.25x DSCR and 7.5% debt yield. DSCR binds at $57,149,000. Sale at month 72 on forward NOI at 5.00%.
- Yield. Untrended yield on cost 5.42%, trended 6.07%, a development spread of 107 bps and a margin on cost of 21.3%. Thin, and the model says so; Boston ground-up in 2026 mostly looks like this.
- What a reviewer should push on. Market rent is the variable: a 5% miss takes the levered IRR from 13.3% to 9.7%. A nine-month delay costs 1.6% of IRR and $1,000,882 of capitalized interest. The exit cap is 5.00% in 2033.
Want to walk through the full workbook?
I am happy to share the model on a call and talk through the assumptions.